ASTRONICS (ATRO)·Q4 2025 Earnings Summary
Astronics Delivers Record Quarter: EPS Beats by 63%, Stock Jumps 4%
February 24, 2026 · by Fintool AI Agent
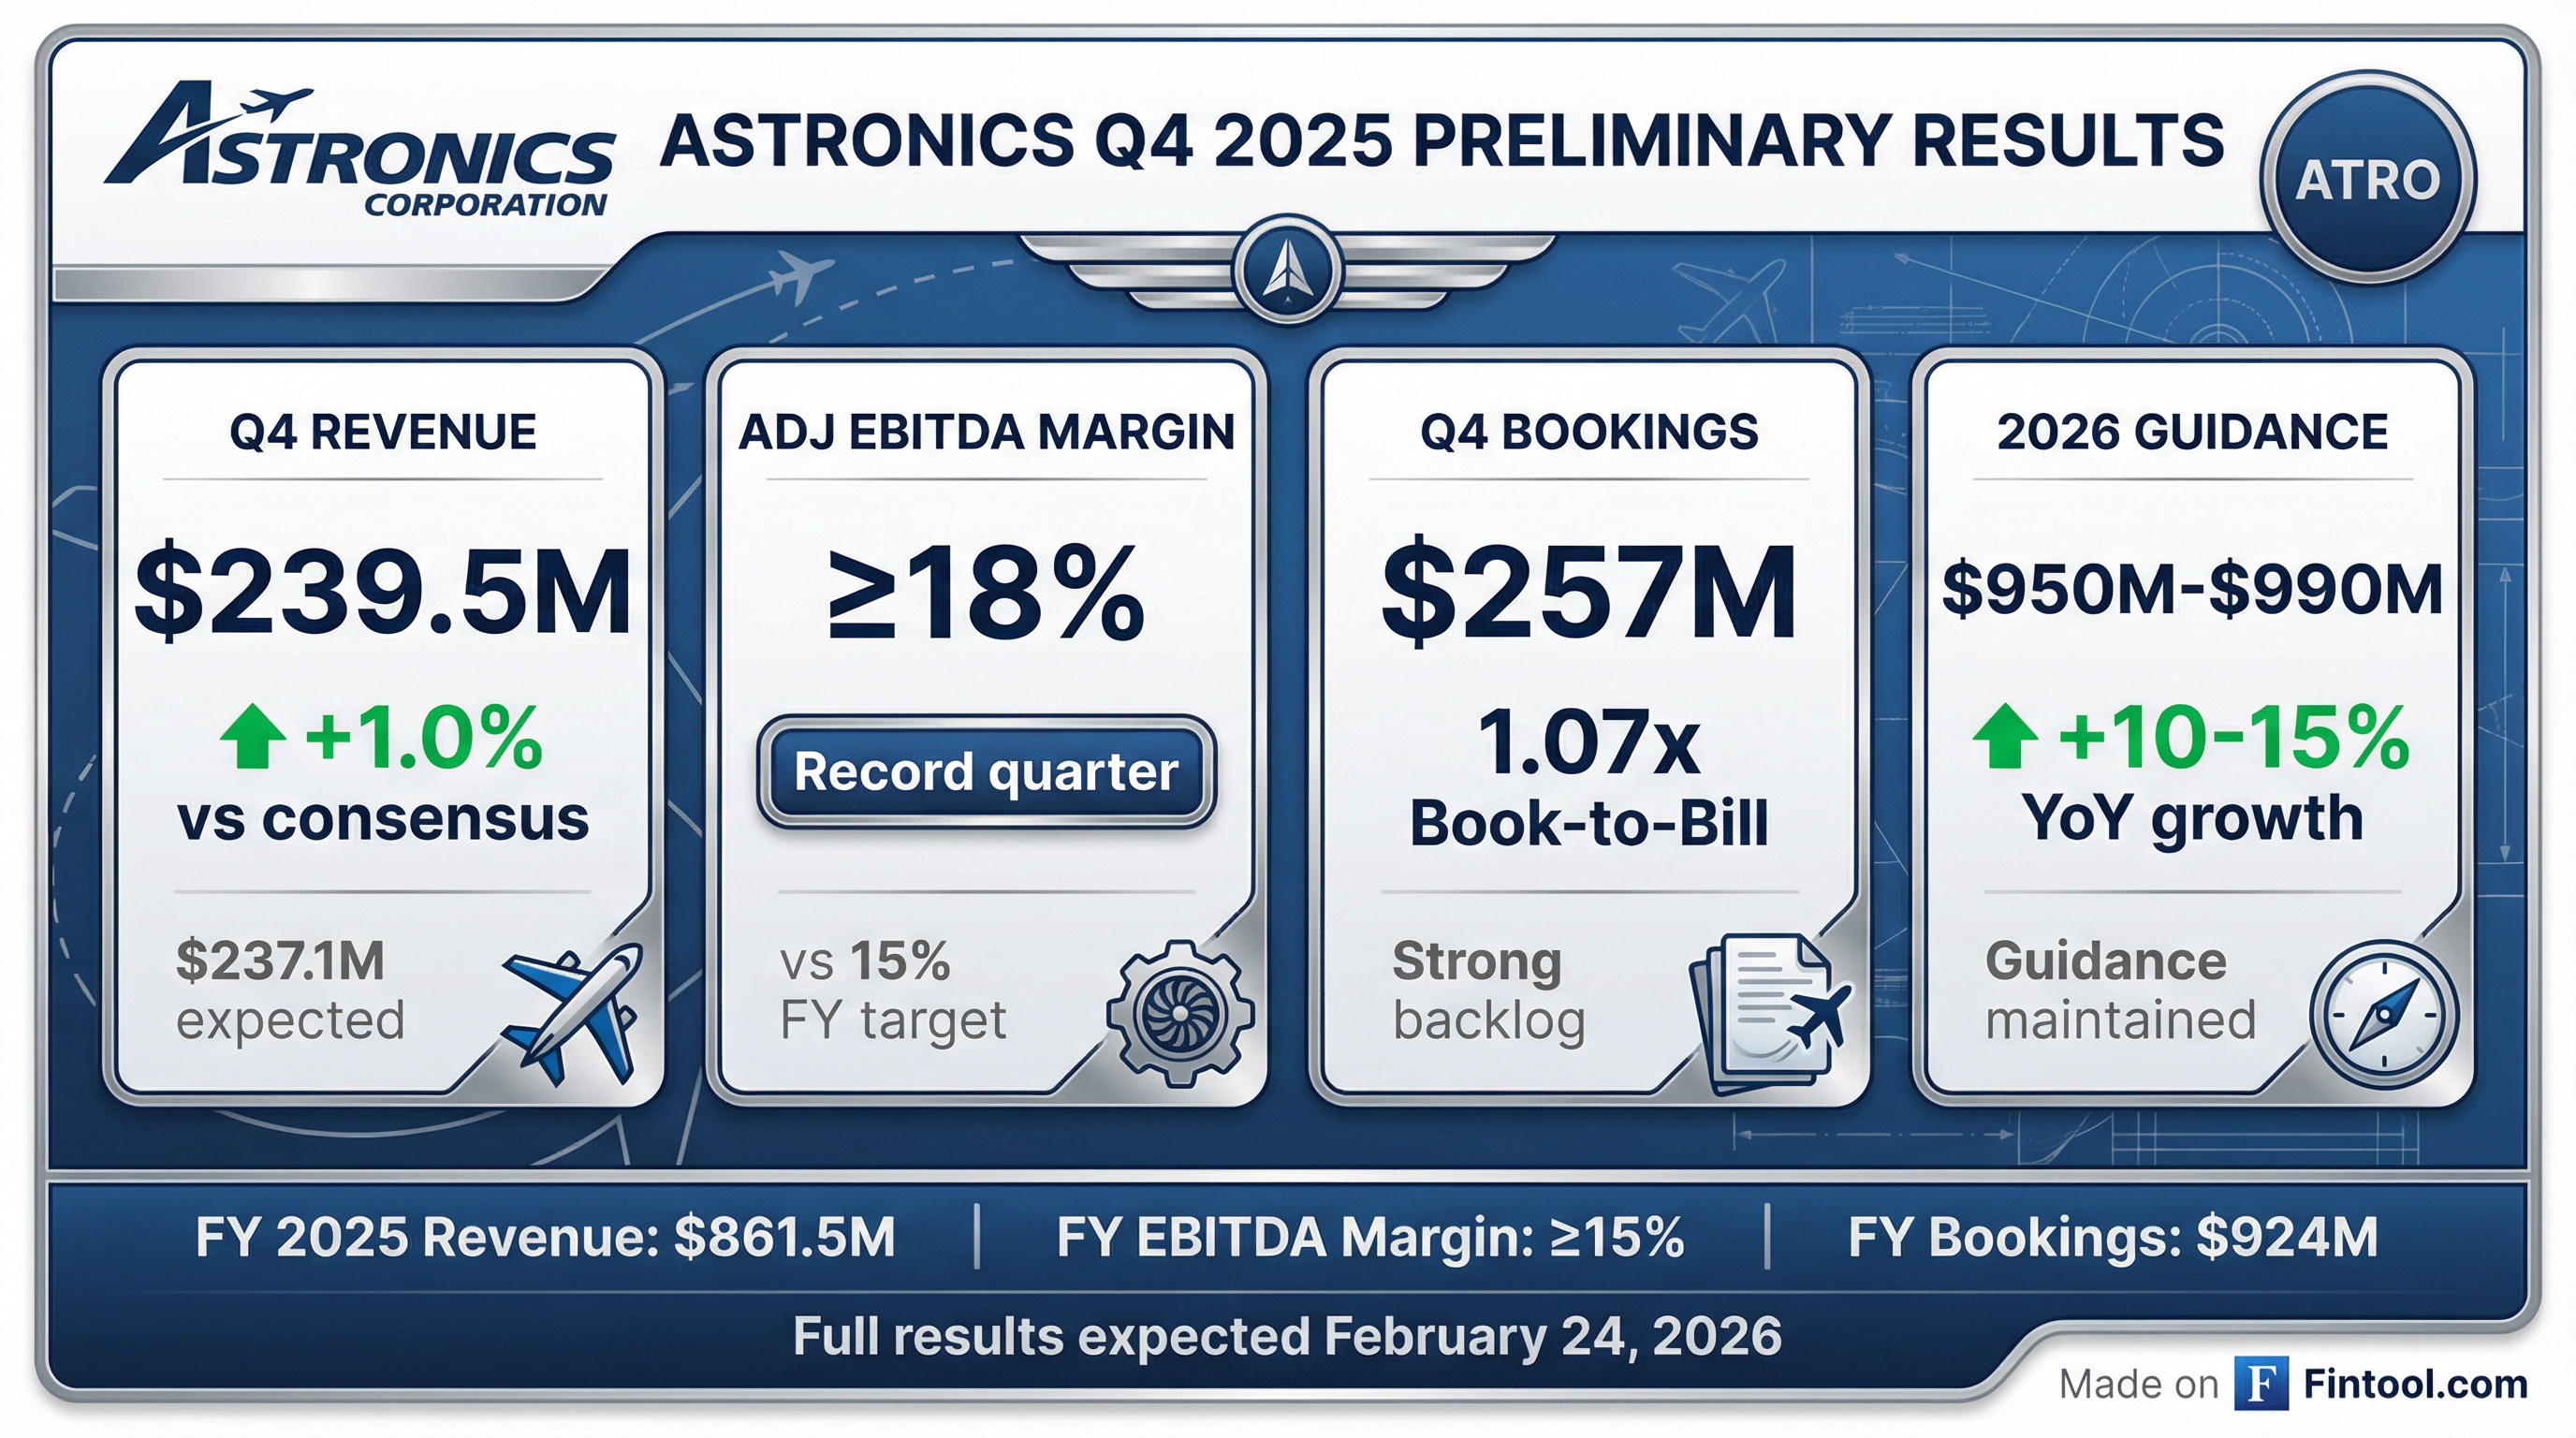
Astronics Corporation (NASDAQ: ATRO) delivered its strongest quarter in company history, reporting record Q4 2025 revenue of $240.1 million (+15.1% YoY) and adjusted EPS of $0.75, crushing Street estimates by 63%. The aerospace and defense supplier achieved a 19.0% adjusted EBITDA margin and ended 2025 with record backlog of $674.5 million.
Shares jumped +4.3% to $79.39 on the results, trading within 3% of the 52-week high of $81.89.
Did Astronics Beat Estimates?
Triple beat. Astronics exceeded consensus on revenue, EBITDA, and EPS:
*Values retrieved from S&P Global
Full-year results: FY 2025 revenue of $862.1 million (+8.4% YoY) with adjusted EBITDA margin of 15.6%. Net income swung to $29.4 million positive vs. a $16.2 million loss in FY 2024, despite a $32.6 million debt settlement charge.
What Drove the Beat?
CEO Pete Gundermann highlighted multiple factors:
- Record Aerospace sales — $219.6M (+16.5% YoY) on strong Commercial Transport demand
- Favorable mix — Higher-margin VVIP and seat actuation products drove outsized profitability
- Pricing initiatives — Including "true up pricing recovery" on certain contracts
- Litigation resolution — $9.3M decrease in legal reserves and expenses vs. prior year
- Tax benefit — Valuation allowance reversal under the "One Big Beautiful Bill Act"
"We made excellent progress in 2025 and ended the year with a strong fourth quarter. Robust demand across our aerospace markets drove record sales in the quarter." — Pete Gundermann, Chairman, President & CEO
Segment Performance
Aerospace (92% of revenue) — Record Quarter
By market:
- Commercial Transport: $167.0M (+18.5% YoY) — cabin power, seat motion, lighting, safety
- Military Aircraft: $28.0M (+14.5% YoY) — pricing, lighting/safety, MV-75 engineering
- General Aviation: $22.3M (+26.0% YoY) — IFEC products to VVIP market
Test Systems (8% of revenue) — Turning the Corner
Management expects a "meaningful improvement" in Test profitability once the U.S. Army radio test program begins production, anticipated "early in the second quarter or soon thereafter."
What Did Management Guide?
2026 full-year: $950M to $990M (maintained), representing +10-15% growth.
Q1 2026: $220M to $230M, up 9% at the midpoint vs. prior year.
*Values retrieved from S&P Global
Notable: Q1 2026 guidance of $220M-$230M is below Street consensus of $237M, suggesting growth will be second-half weighted. Management stated the year will see "double digit growth, weighted slightly toward the second half."
Margin outlook: Management is "striving to consistently deliver high-teens operating margins for the consolidated business which should be realizable with the expected improvement with the Test business."
How Did the Stock React?
The positive reaction reflects the triple beat on revenue, margins, and EPS, despite Q1 guidance coming in below Street expectations. ATRO has now delivered 8 consecutive quarters of EPS beats and the stock is up ~300% from its 52-week low of $19.41.
What Changed From Last Quarter?
The step-up materialized. In Q3, management guided Q4 revenue of $225M-$235M. Actual results of $240.1M exceeded even the high end by $5M.
Margin expansion accelerated. The 19.0% Aerospace operating margin surpassed management's "near-term margin target" and demonstrates the segment's earnings power at scale.
Balance Sheet & Cash Flow
Debt recap: Net debt increased due to refinancing activities that repurchased 80% of the $165M 5.5% convertible bonds, replaced with $225M of 0% convertible bonds plus a capped call structure. The company also entered a new $300M senior secured revolving credit facility (expandable to $400M) maturing October 2030.
2026 capex: $40M-$50M, including Seattle facility consolidation, plus $14M-$18M for ERP implementation.
Forward Catalysts
- OEM build rate ramps — Boeing and Airbus increasing narrow-body and wide-body production
- Army radio test program — $215M IDIQ contract, production orders expected early Q2 2026
- FLRAA/MV-75 — Bell's Black Hawk replacement; Astronics supplies electrical power distribution
- BMA synergies — German seat actuation acquisition adds motion systems capabilities
- Passenger connectivity — Secular airline demand for in-flight power and entertainment
Historical Beat/Miss Track Record
Astronics has delivered 8 consecutive quarters of EPS beats:
*Values retrieved from S&P Global
Key Risks
- Q1 2026 guidance below consensus — $220M-$230M vs. Street at $237M suggests near-term reset
- Test segment dependency — Profitability hinge on Army program production orders
- Tariff exposure — Q4 included $2.9M increase in tariff expense
- Boeing/Airbus execution — Customer production rates remain key demand driver
- Debt load — Net debt of $325M elevated after refinancing
What's Next?
- Q1 2026 earnings: Expected ~May 2026
- Army program production orders: "Early in the second quarter or soon thereafter"
- Earnings call: Conference call today at 4:45 PM ET
This analysis is based on the Astronics 8-K filed February 24, 2026, announcing Q4 and full-year 2025 financial results.